I work on a remittance platform with 50+ destination countries, dozens of payout partners, multiple payment methods, and apps on two platforms. We have Grafana dashboards, alerting, per-corridor metrics. The usual setup.
And we still miss things. The setup is solid for binary failures: a service is down, an endpoint is returning 500s. But static thresholds don’t adapt to context. A low-volume country that drops 40%, but it’s 200 transactions, invisible in aggregate traffic. Cross-dimensional patterns that no single metric catches on its own.
Our ops team does a great job with alerting. But the process is inherently reactive: something breaks, we learn from it, we add a new alert so we catch it next time. Then something different breaks. We learn, we add, we catch that one next time too. The cycle keeps going. The alerts we have are solid. The problem is the failures we haven’t seen yet aren’t covered.
I started thinking about this differently. Instead of adding more dashboards, I wanted to build something with actual layers, where each layer catches what the one below misses.
What we had and what was missing
We had Grafana. Static rules, static thresholds. If success rate drops below 95%, page someone. This catches binary failures: a service is down, an endpoint is returning 500s. Fast and deterministic.
But it can’t adapt to context:
30% volume drop at 3 AM on a Sunday → normal
30% volume drop at 2 PM on a Tuesday → crisis
Same metric, same threshold. Completely different meaning. And no amount of new Grafana panels fixes that, because the problem isn’t missing dashboards. It’s that static thresholds don’t know what “normal” means for a given corridor, day, or season.
What the old setup couldn’t catch
Four categories of failures that were structurally invisible before:
- Fraud under per-transaction thresholds. Cross-dimensional pattern: one payment method in one country spikes 5x, everything else holds steady. No single metric is out of bounds. When statistics flag it, the LLM digs into behavioral signals: new accounts, device clustering, timing patterns. Figures out if it’s random or coordinated.
- Slow degradation. Partner success rate drifts down 0.3%/day for three weeks. Each day is within variance. By week three, thousands of transactions are failing. No single day was anomalous enough to alert.
- Low-volume corridor problems. A country doing 200 transactions/week drops to 120. A 40% decline, invisible in aggregate metrics. Per-corridor baselines help in theory, but low-volume corridors produce unreliable baselines.
- Multi-factor outages. Partner success rate down 2%, volume down 10%, new error code in logs. Each one fine on its own. Together they mean the partner is failing silently.
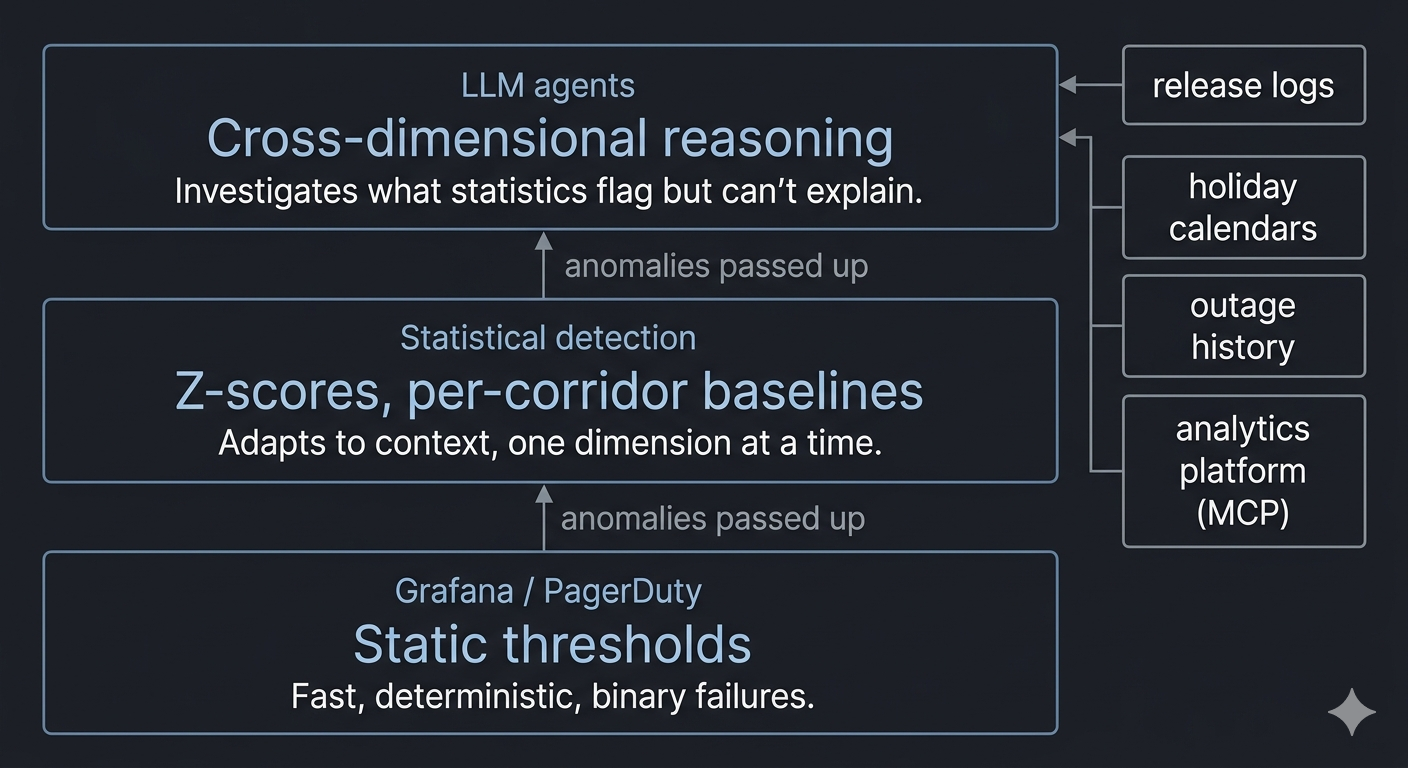
What I built: two new layers
I introduced two layers on top of the existing alerting. Statistical detection as the first new layer, and LLM agents as the second. The key decision was figuring out which technology to use where, and why.
The tech stack: Claude CLI as the reasoning engine, an MCP server connected to our analytics platform for live data queries, and shell scripts for orchestration and scheduling. No custom infrastructure. The agents run as cron jobs, query data through the MCP server, and write reports to disk. I built and tested the prototype locally, then handed it off to the engineering team to operationalize: automated scheduling, corporate accounts, production infrastructure.
Statistical detection
What it does: Z-scores, per-corridor baselines, trend analysis. Good at: Deviations from rolling averages. Fast, cheap, deterministic. Blind spots: Operates on one dimension at a time.
I started here because I needed a systematic way to compare today’s numbers against what’s normal. Rolling averages, modified Z-scores, per-corridor baselines. The definition of “normal” adapts over time, which is a big step up from static thresholds.
But it turned out to be harder than I expected:
- Low-volume corridors produce noisy baselines. Three hundred transactions per week means a single bulk sender triggers false alerts.
- High-volume corridors have the opposite problem. A 2% drop representing thousands of failed transactions looks statistically insignificant.
- Holidays are everywhere. With 50+ destination countries, there’s a holiday somewhere almost every week. Eid. Lunar New Year. Father’s Day in Honduras. National elections. Each one creates a spike or dip that triggers an outage call, pulls people into a war room, and wastes an hour before someone figures out it’s a holiday in Senegal.
Modified Z-scores using median absolute deviation helped with the noise. Holiday calendars helped with seasonal suppression. But even well-tuned statistics operate on one dimension at a time. They can tell you a corridor is down, or a payment method is spiking. They can’t tell you a corridor is down because of a specific payment method on a specific platform, and that the combination looks like fraud.
That’s where I needed something different.
LLM agents
What it does: Cross-dimensional reasoning, contextual investigation. Good at: Multi-factor and novel failures, natural language investigation reports. Blind spots: Slow, costly per query, non-deterministic output.
This layer sits on top of statistical detection. It reasons across dimensions, pulls context from multiple sources, and investigates the anomalies that statistics flag but can’t explain. The statistical layer tells it something is off. The LLM figures out what it means.
I also feed it release logs (what was deployed and when) and recent outage history. So when the agent sees a drop in success rate, it can check whether there was a deploy 20 minutes ago or an ongoing incident in the same corridor. That kind of correlation is trivial for a human but impossible to encode in threshold rules for every combination.
How the two layers cooperate
The split is simple: statistics detect, LLMs investigate.
Statistics → LLM handoff. Modified Z-score flags a corridor anomaly. The LLM agent picks it up and runs a scan-then-isolate chain: break the anomaly down by payment method, delivery method, platform, partner. 7-8 broad queries, then 3-5 targeted drill-downs. Root cause in minutes.
Contextual suppression. Before the LLM even looks at anomalies, it loads known remediations, holiday calendars, release logs, and recent outage history. Suppress before detect. A 30% drop during Eid in a majority-Muslim corridor never becomes an alert. A corridor at zero for a payment method that was disabled last week gets skipped. This eliminates the false alarms that used to pull people into war rooms for nothing.
Investigation output. When the agent does alert, the output isn’t “metric below threshold.” It’s: “Volume in this corridor dropped 18% since 2 PM, isolated to bank deposits, both platforms affected equally. Looks like a partner-side issue, not a client regression. Partner success rate down 3% in the same window.” Half an hour of operator investigation, delivered with the alert.
Pattern matching. The agent carries a library of known incident patterns (slow partner degradation, release regression, coordinated fraud) and checks current signals against them. Not a rigid classifier, but informed reasoning: “This looks like slow partner degradation. Success rate drifting down, no error code changes, volume declining proportionally.”
State across runs. Each report ends with machine-readable tags (corridor, severity, metric). The next run greps the prior reports and loads them into context, so the agent doesn’t re-discover the same anomaly every cycle. If a finding persists for 3+ cycles, it auto-escalates.
How the investigation actually works
The agent follows a structured investigation chain, but it’s not rigid. It makes pragmatic decisions about which steps to run and which to skip based on what it finds along the way.
The investigation chain
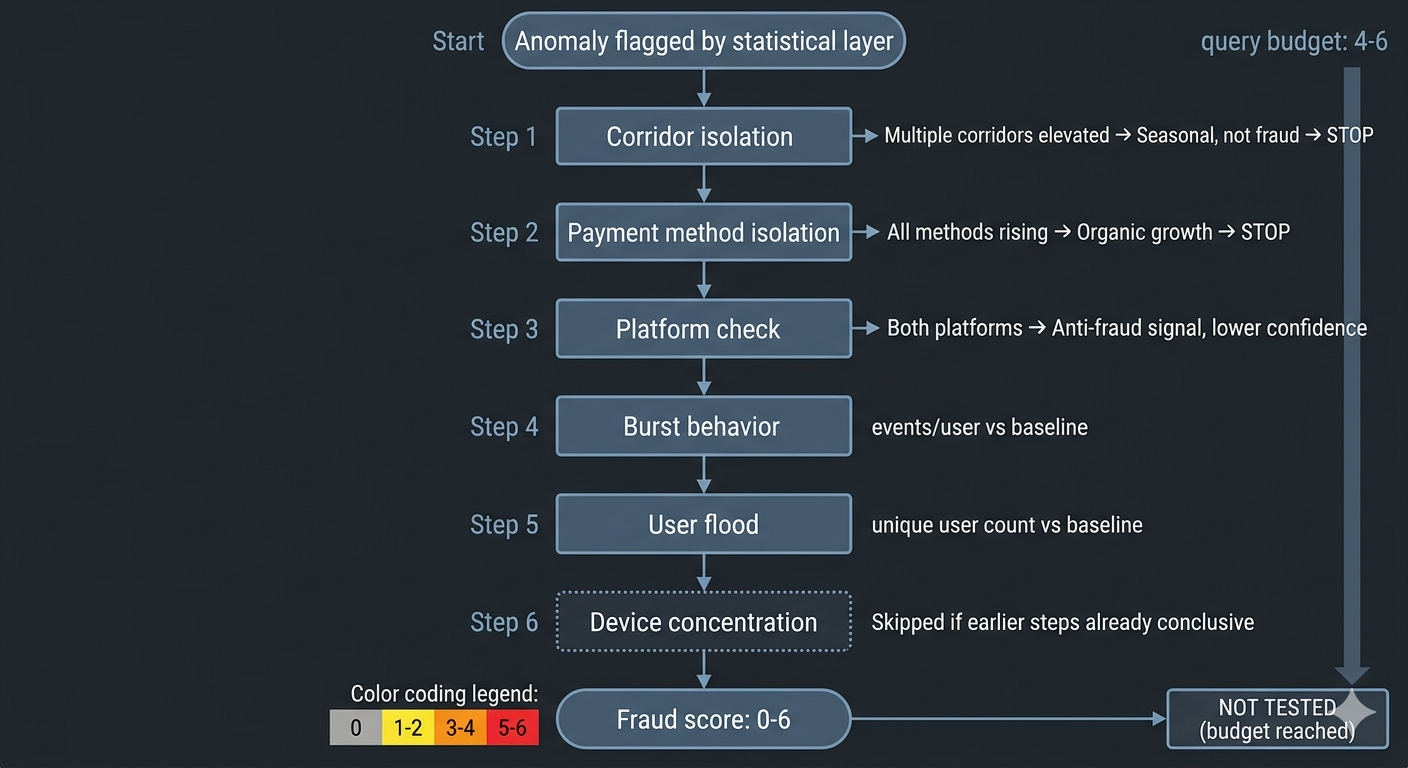
When the statistical layer flags an anomaly, the LLM agent runs through these steps:
- Corridor isolation. Is the anomaly in one corridor or spread across several? If multiple African corridors are all up, that’s seasonal, not fraud.
- Payment method isolation. Is it one payment method or all of them? A single method spiking 5x while others hold steady is a very different signal than everything rising together.
- Platform check. iOS only? Android only? Both? A single-platform spike suggests a client-side issue or device farm.
- Burst behavior. Events per user compared to baseline. Normal is 1-2 events/user. Above 2x baseline starts looking coordinated.
- User flood. How many unique users? A spike from 40 to 200 unique users in one corridor is different from the same volume coming from 5 accounts.
- Device concentration. Are the events coming from a narrow set of devices? This step is expensive, so the agent skips it when earlier steps already rule out fraud.
The agent tracks a query budget (4-6 queries per run) and explicitly stops when it runs out: “NOT TESTED (query budget reached).” It doesn’t guess when data is missing. It says “UNKNOWN” and adjusts confidence accordingly.
The fraud scoring rubric
Each investigation produces a fraud score based on 6 binary indicators:
| Score | Meaning |
|---|---|
| 5-6 | Almost certain coordinated fraud |
| 3-4 | Likely fraud, needs immediate attention |
| 1-2 | Unusual but may be organic |
| 0 | Statistical noise |
The six indicators: single payment method isolated, single platform, burst behavior (>2x events/user), user flood (>3x unique users), device concentration, single corridor isolated.
What makes this work in practice is that the agent scores against fraud too, not just for it. If the traffic is split across platforms, that’s an anti-fraud signal. If multiple corridors are elevated, it’s probably seasonal. The agent explicitly states these counter-signals: “100% iOS at this hour, which argues against a device farm pattern.”
What the output looks like
A representative alert (constructed from the format the system uses, with fictional data):
HEARTBEAT -- 2026-07-09 10:00 (Wednesday)
STATUS: RED

[RED] ANOMALY DETECTED -- [payment method] to [corridor]
WHAT:      Events: 143/hr (baseline median: 18/hr, modified Z-score: 6.73)
SINCE:     Spike began at 07:00, escalating each hour (31, 68, 143)
TREND:     Rising -- exponential growth pattern

SIGNALS:
  1. Isolated corridor    -- YES. Only [corridor] elevated (Z=6.73).
                             Next highest corridor Z=0.8.
  2. Isolated method      -- YES. All other payment methods at baseline.
  3. Single platform      -- YES. 85% iOS.
  4. Burst behavior       -- YES. 3.6 events/user (baseline 1.3, 2.8x).
  5. User flood           -- YES. 143 unique users (baseline 16, 8.9x).
  6. Device concentration -- NOT TESTED (sufficient evidence from steps 1-5).

FRAUD SCORE: 5/5 scored (1 not tested) -- Almost certain coordinated fraud
HYPOTHESIS: Pattern consistent with coordinated payment method abuse.
            Single method, single corridor, single platform, with burst
            and flood behavior well above baseline.
CONFIDENCE: High

RECOMMENDED ACTIONS:
  1. Investigate [payment method] transactions in [corridor] for last 4 hours
  2. Consider temporary velocity limits on this method/corridor combination
  3. Escalate to fraud team if pattern continues next hour
This is what operators see when a call starts. They’re not spending 30 minutes figuring out which corridor, which method, since when. That work is done.
Backtesting
Before putting this into production, I ran it against historical data with known incidents. The backtest engine replays detection across a sequence of dates, computes baselines, runs the investigation chain, and produces a summary: date, severity, method, spike multiplier, signal count.
This was the point where I got confident the system worked. On historical data with a known incident, the agent fired a RED alert on day 1. The operations team had caught it on day 5. Four days earlier detection, zero false positives on the control dates.
I’d recommend building the backtest framework before the live system. It’s faster to iterate when you can replay a week of data in seconds instead of waiting for real anomalies to show up.
Four tiers, four cadences
Running one LLM sweep per day sounds reasonable but misses the point. Different questions need different cadences, and the non-trivial cases need continuous attention.
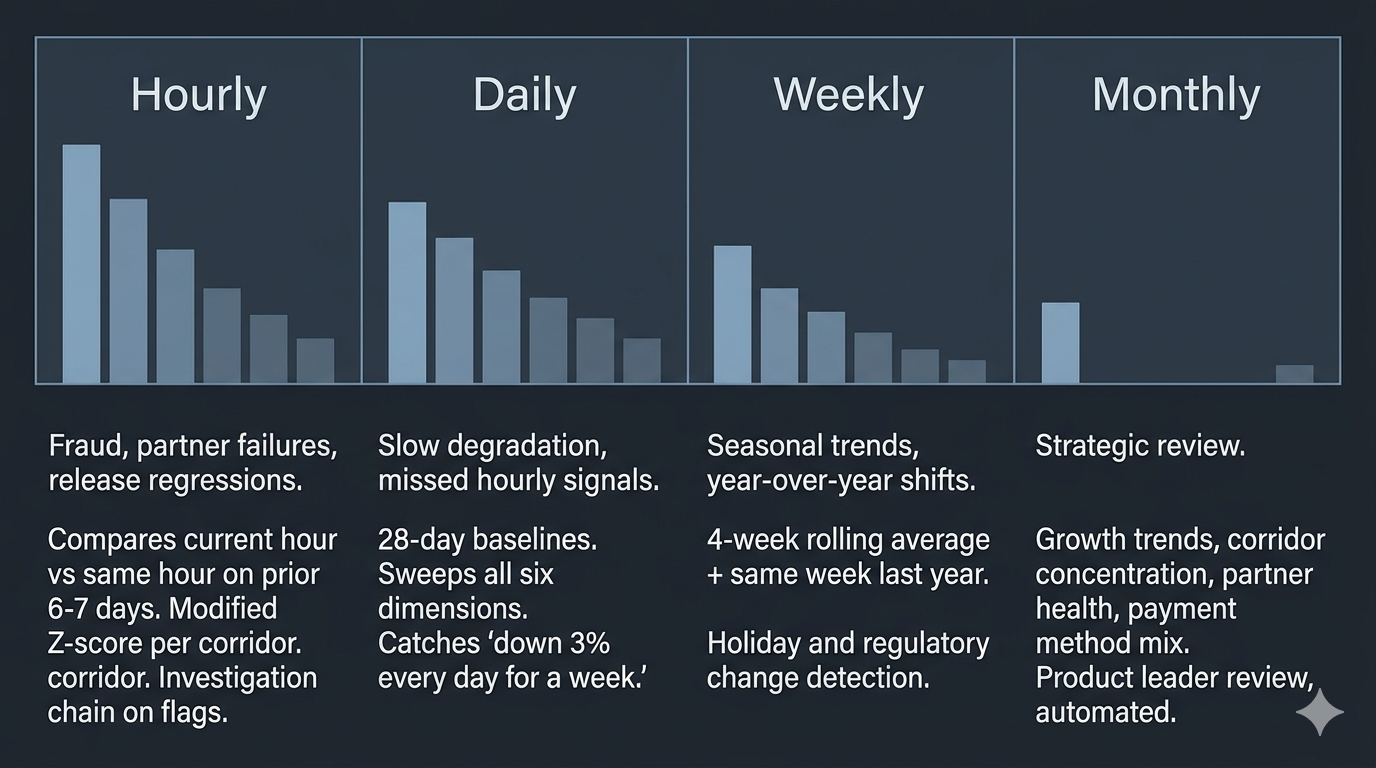
Hourly is the workhorse. Fraud, acute partner failures, release regressions: these can’t wait for a daily report. The hourly agent compares the current hour against the same hour on the prior 6-7 days, using a modified Z-score tuned for the specific corridor’s volume. When something flags, it runs an investigation chain (broad scan, triage, platform isolation, behavioral analysis, verdict). Takes a few minutes, costs a few cents.
Daily is the safety net. It sweeps all six dimensions with 28-day baselines, catching things the hourly agent missed because they were within single-hour variance but are clear over a full day. This is where you spot “down 3% every day for a week.”
Weekly is where you add year-over-year comparison. Seasonality in remittances is real. The same week can look completely different year to year because of holiday shifts or regulatory changes. Comparing against both a 4-week rolling average and the same week last year catches trends that daily baselines absorb too quickly.
Monthly is strategic. Growth trends, corridor concentration, partner portfolio health, payment method mix shifts. This isn’t operational monitoring. It’s the review a product leader would do manually, made automated and consistent.
What this costs
Four agent tiers against a production analytics platform run about $6-18 per day in API fees.
It doesn’t replace the on-call team or the Grafana dashboards. But when an outage call starts, the team isn’t starting from scratch. The agent has already done the initial investigation: which corridors, which payment methods, when it started, whether there was a recent deploy. That cuts the “figure out what’s actually happening” phase from 30-60 minutes down to reading a report.
But the real argument isn’t efficiency. It’s coverage. The 40% drop in a 200-transaction corridor, the slow partner degradation, the multi-factor outage: these aren’t things that get investigated slowly. They’re things that never get seen at all. The cost of a missed incident in financial services (regulatory exposure, customer loss, partner damage) makes $18/day irrelevant.
What doesn’t work yet
The system has real limitations I haven’t solved.
False positive rate is still too high for low-volume corridors. A corridor doing 50 transactions a day doesn’t have enough data for stable baselines. The agent flags things that turn out to be normal variance. I’ve tuned the Z-score thresholds per volume tier, but the fundamental problem is statistical: small samples produce noisy signals.
Each investigation run takes 2-4 minutes and uses 7-12 queries against the analytics platform. That’s fine for hourly cadence, but it means the system can’t react to something that spikes and resolves within 15 minutes. Real-time this is not.
The LLM sometimes hallucinates correlations. It’ll see a deploy and a success rate dip in the same window and conclude causation. Usually the timestamp check catches this (the deploy was after the dip started), but not always. I’ve added explicit instructions to verify temporal ordering, which helped but didn’t eliminate it.
No feedback loop from operators. When the agent gets something wrong, nobody tells it. The reports get read, the team acts or doesn’t, but nothing flows back. I want to add a simple thumbs-up/thumbs-down on each finding that feeds into the next cycle’s context, but haven’t built it yet.
What I’d do differently next time
Holiday calendar integration from day one. This turned out to be the single biggest source of false signals in our setup, and it should have been the first external data source I added. Before deploy logs, before Jira tickets, before anything else.
I’d also start with the daily sweep instead of hourly. I built hourly first because it felt most like “real monitoring.” But daily gives more learning per iteration. Baselines are more stable, patterns are clearer, and it’s easier to iterate on the dimensional analysis before committing to an hourly cadence.
And the four tiers should share state better. Right now each runs independently, which means redundant queries and occasionally inconsistent findings. Even something as simple as a shared findings file that all tiers read and write would help.
This is happening everywhere
When I started building this, I thought I was experimenting. Turns out the industry is moving fast in the same direction.
Datadog shipped Bits AI SRE in late 2025, an autonomous agent that investigates alerts 24/7 across 2,000+ customer environments. PagerDuty launched an AI SRE agent that integrates with Azure. AWS released a DevOps Agent that connects to Datadog, Dynatrace, and Splunk for cross-source investigation. LogicMonitor built Edwin AI for multi-source reasoning across logs, metrics, and knowledge bases.
Closer to fintech, Razorpay published a detailed write-up of their Oncall Agent: a multi-agent system that reduced their mean time to investigate from 30 minutes to 90 seconds. Same architecture I landed on independently: statistical detection feeding into LLM investigation, with specialized agents for different subsystems.
Startups are flooding in too. Traversal (backed by Sequoia, used by American Express) does causal root cause analysis. incident.io ships an always-on AI SRE. Neubird handled 230,000 alerts autonomously in 2025 across healthcare, banking, and retail.
A year ago this was experimental. Now it’s becoming table stakes for any platform complex enough to have blind spots in its monitoring.